By: Devika Kandelwal
November 3 2021

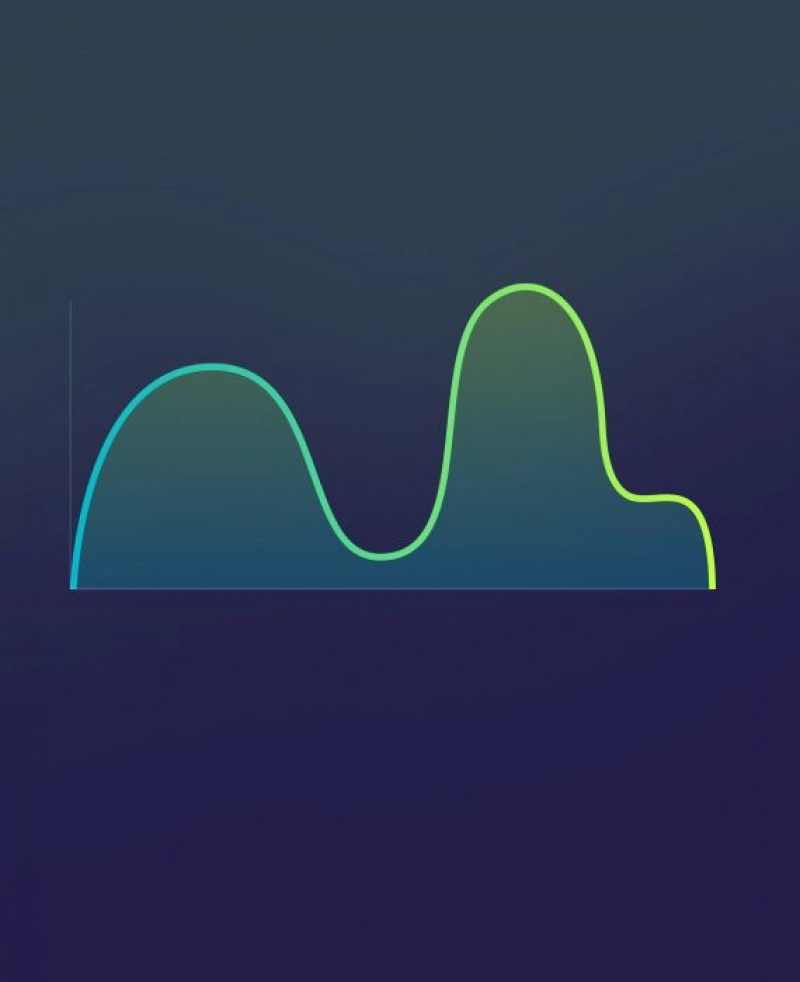
The image released by the government was badly labelled and misled people into believing it changed its plans.
The image released by the government was badly labelled and misled people into believing it changed its plans. On June 23, the UK government announced the easing of lockdown restrictions. Pubs, restaurants, hotels, and hairdressers will open from July 4, and the new ‘one meter plus’ rule would be introduced. Since the announcement, an image has been doing the rounds on social media, which suggests that this decision is contrary to the Government’s previously stated plans on how reopening would be managed. The image suggests that the Government had planned on easing the lockdown in three stages, based on ‘R’, or the ‘reproduction rate’ of COVID-19 (according to which, if R=1 then each person with COVID-19 is spreading the disease to an average of 1 other person, if R=0.5 then each case causes an average of 0.5 further cases, etc). However, the graphic is misleading as the curve does not refer to 'R', but to the total COVID-19 caseload. This is clear from the context of the government report in which the original graphic appears, although the original version of the graph does not provide axis labels or units of measurement, factors which probably contributed to the misinterpretation of the graph. The COVID-19 pandemic has given rise to a lot of potentially dangerous misinformation. For reliable advice on COVID-19 including symptoms, prevention and available treatment, please refer to the World Health Organisation or your national healthcare authority.