By: Vivek J
December 15 2022

A small spike in the snow cover extent in mid-November 2022 has been misrepresented to claim that global warming and climate change are not real.
Context
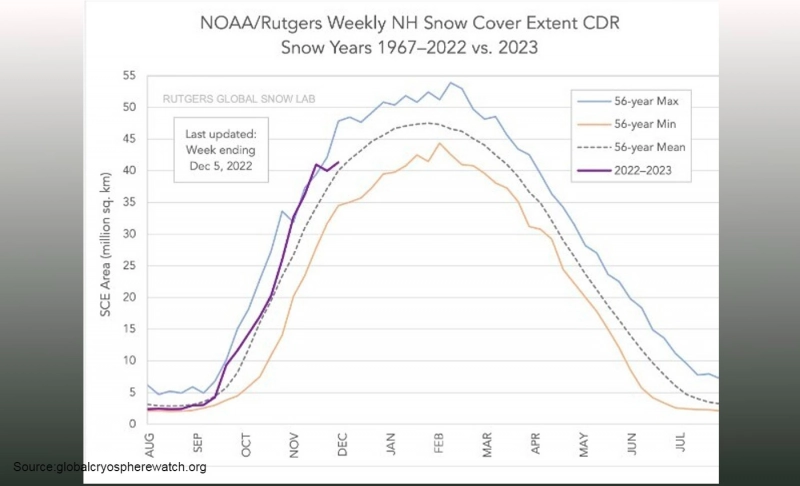
An article published by the website Zero Hedge, and republished on the blog Algora on December 3, gauging data from the norther hemisphere amid its winter season is being shared on Facebook with attempts to ridicule the COP27 summit held in Egypt in November 2022. Several people shared the same on other platforms like Twitter and TikTok. It cites data recorded by the National Oceanic and Atmospheric Administration (NOAA) and Rutgers University Global Snow Lab on snow cover in the Northern Hemisphere in November 2022. A chart with the maximum, minimum, and mean snowfall from 1967 to 2022 is shared to show that snow cover in mid-November was at the highest ever in the northern hemisphere. This data point is used to claim that global warming and climate change are imaginary and not worthy of concern. However, the assertions made in the article are incorrect.
In Fact
The NOAA/Rutgers data cited in the Zero Hedge article is the weekly snow cover extent of the Climate Data Record (CDR). The screenshot shared in the article points out that the November graph shows more snow cover than recorded during that period in 56 years and implies that this disproves claims of global warming. The data in the chart is updated weekly by NOAA/Rutgers and can be found on the Global Meteorological Organization's "Globalcryospherewatch" website. The latest chart on the website at the time of writing was from December 12, 2022, showing a drop in snow cover extent. This chart is updated every week, and it is standard for snow cover to go above and below the mean average.
Rutgers University professor and New Jersey state climatologist Dr. David Robinson who overlooks the Rutgers Snow Lab told Logically via email that the graph in question was from mid-November when there was one period when the northern hemisphere continental snow cover extent exceeded any such period during the satellite era (1966-2022). He also noted that "November 2022 had the fourth most extensive snow cover of the satellite era," calling this impressive but not a record. He added that the two weeks after showed snow cover trending back towards normal.
This shows that while the snow cover seen may have been at a record high for the mid-November period between 1966-2022, it was not at a 56-year high. The Zero Hedge article claims snow cover in November reached the highest level since measurements began in 1967. This is clearly an inaccurate conclusion.
Dr. Robinson also said, "There were weather events across Northern Hemisphere lands that led to the pronounced mid-November snow coverage. Subsequently, other weather events occurred that briefly the coverage of snow, and then the expected seasonal increase in coverage resumed in early December, close to the normal coverage for this time. One week, month, or season is not reflective of any change in local, regional, or global climate."
The World Meteorological Organization has also published a snow cover chart by the Finnish Meteorological Institute that shows a dip in snow cover in late November 2022. A scientific report published in Nature also found that from 1982 to 2020, the time series of 38 years indicated a negative trend in snow cover in global mountain regions.
The northern hemisphere snow cover anomalies chart on the Rutgers Snow Lab website from 1966 to November 2022 also shows the variation in snow cover during this period. A Rutgers map showing November's snow cover extent departure from the 1981-2010 mean also depicts extreme variations. Thus, it is normal for snow cover to vary depending on the local weather events and other similar factors.
Furthermore, an NOAA data chart on global temperature for the past century published by the United States Environmental Protection Agency (EPA) shows a steady increase in temperatures since the mid-20th century. Similar datasets are verified by scientists globally and have confirmed a rising trend in global temperatures mainly due to the greenhouse effect.
An Intergovernmental Panel on Climate Change (IPCC) report titled "Climate Change 2021: The Physical Science Basis" also notes that emissions of greenhouse gases from human activities are responsible for approximately 1.1°C of warming since 1850-1900. Its findings indicate that averaged over the next 20 years, global temperatures are expected to reach or exceed 1.5°C of warming.
Logically has previously debunked similar claims on climate change denials citing weather events like the New York snowstorm.
The Verdict
Historical data and multiple studies show a declining trend in snow cover in the Northern Hemisphere. Snow cover varies across regions from time to time due to various local weather events. The Zero Hedge article cites a small spike in snow cover in mid-November 2022 but this small change, incidentally followed later by a reduction in snow cover, neither represents a more significant trend in the northern hemisphere nor disproves global warming. Therefore, we have marked this claim as misleading.